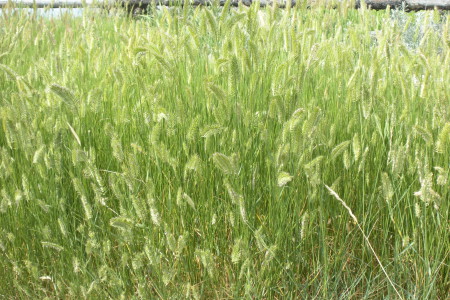
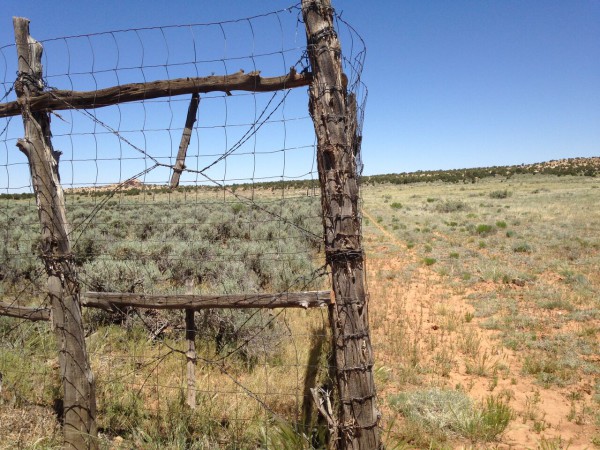
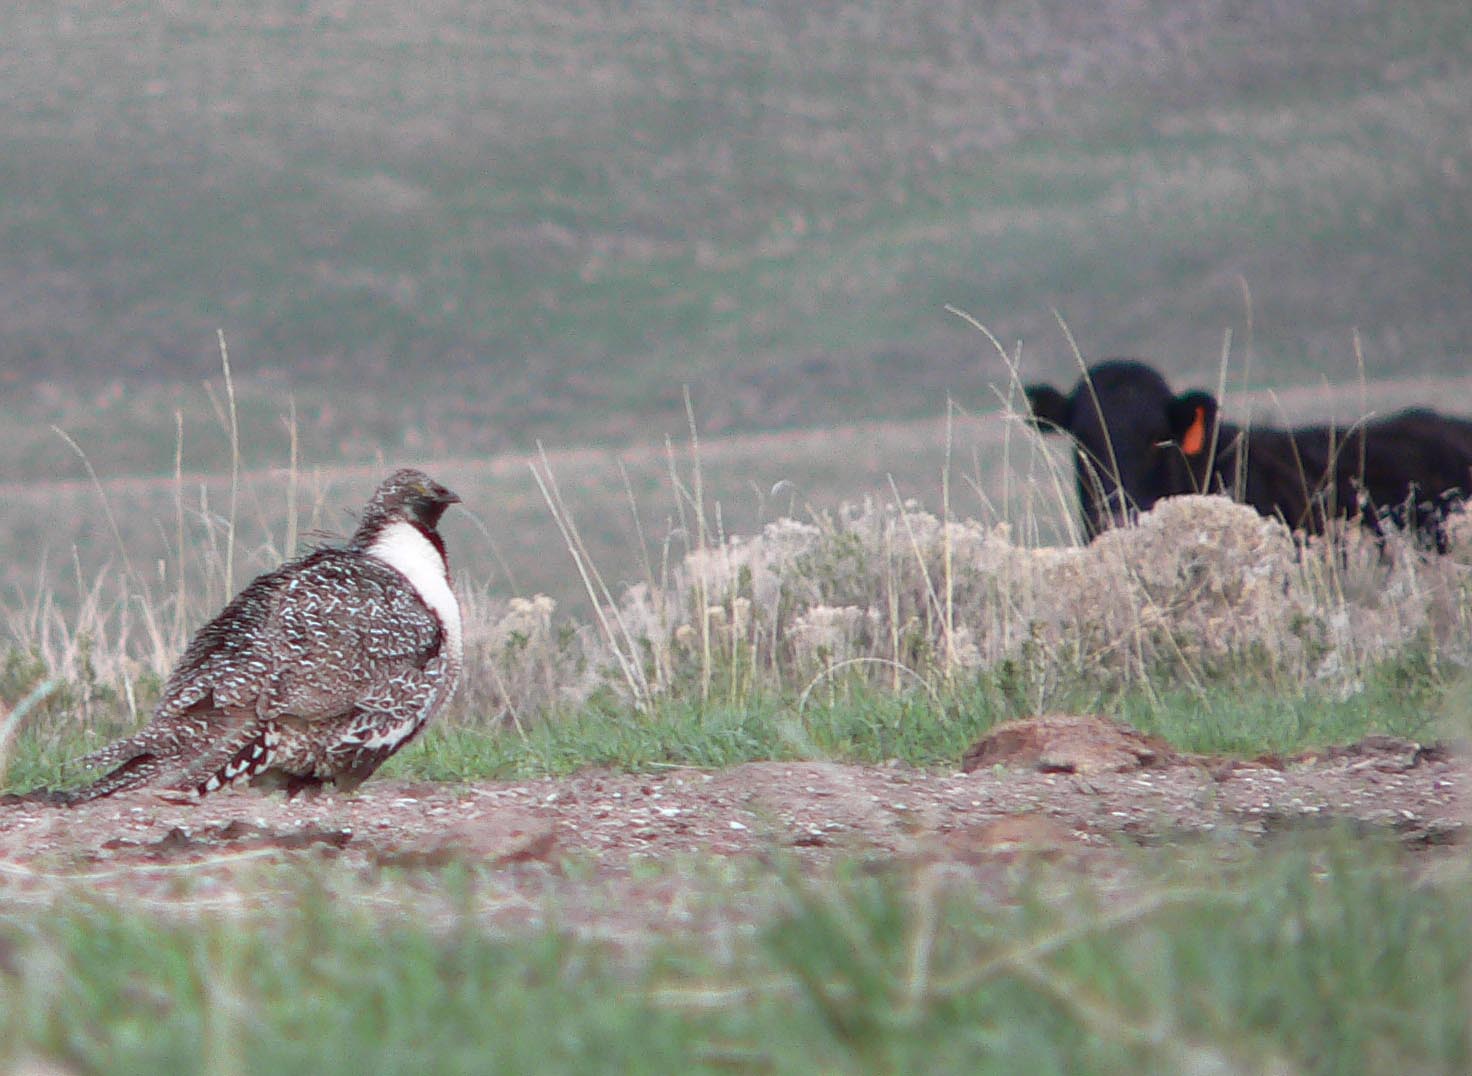
I have many problems with the article by Ken Cole that’s cited below, but the statement I found most ridiculous is highlighted in red. In paragraph three of the article he wrote: “For years the BLM in Idaho has intentionally destroyed intact sagebrush and planted the non-native crested wheatgrass in its place. BLM also seeded crested wheatgrass as a very large part of its post-fire “rehabilitation”. This was done in an attempt to increase livestock forage but it merely shifted use to native grasses such as the native poa and others because the cattle don’t like crested wheatgrass, which is coarse and high in silica.”
Crested wheatgrass (CWG) was planted throughout the West on both private and public land beginning in the early 1900s. It was and still is valued a forage because it is drought, heat, cold and grazing tolerant. CWG provides nutritious forage very early in the spring and is palatable to sheep, cattle, deer and elk. Livestock daily gains on CWG are often twice that of native range and gain per acre on CWG can be 10 times that of native range. CWG stands are resistant to invasion by weedy species (Holechek 1981, Dwyer and Owens 1984). However, many believe CWG should not be planted on public lands because it is not native to the U.S. I think (my opinion) it is absurd to believe rangeland managers have seeded over 12 million acres of rangeland in the U.S. to a forage livestock “don’t like.”
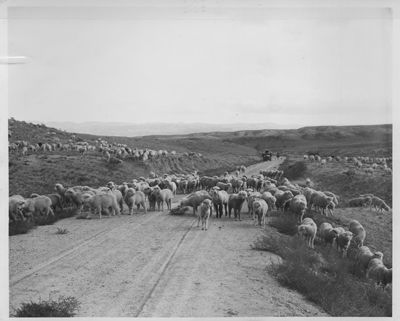
Cattle often prefer CWG over native grasses. During the vegetative stage and after seed head emergence, cattle strongly preferred CWG to seven native grass species (bluebunch wheatgrasses Idaho fescue, bottlebrush squirreltail, needle-and-thread, Sandberg’s bluegrass, Thurber’s needlegrass, and giant wildrye). For example in the vegetative stage, cattle spent 80 percent of their time grazing CWG and took 81 percent of their bites from CWG even though it made up only 6 percent of pasture biomass. After seed head emergence, cattle spent 92 percent of their time grazing CWG and took 90 percent of their bites from CWG. However, CWG was the least preferred grass species when grasses were dormant (Cruz and Granskopp 1998). Cattle preferred CWG to four native grasses (basin wildrye, bluebunch wheatgrass, thickspike wheatgrass, and Snake River wheatgrass) (Ganskopp et al. 1997; Jones et al. 1994). Lastly ewes allowed to freely graze different pastures, preferred to graze crested wheatgrass before grazing native range (Smoliak 1968).
As far as silica content, Shewmaker et al. (1994) determined the silica content of bluebunch wheatgrass, crested wheatgrass, squirreltail, tall wheatgrass, wild barley, Russian wildrye, bulbous barley, and great basin wildrye. Silica content of CWG leaves and stems was similar to the silica content of leaves and stems of the other grass species in the study. Bluebunch wheatgrass stems contained more silica than any of the other grasses including CWG. Furthermore, these grasses contained such low levels of silica that it was not considered a deterrent to grazing.
References:
Cruz, R and D Ganskopp 1998. Seasonal preferences of steers for prominent northern Great Basin grasses. Journal of Range Management 51:557-565.
Dwyer, DD and ME Owens. 1984. Grazing crested wheatgrass range in the Intermountain West. Rangelands 6: 29-31.
Ganskopp, D, B Myers, S Lambert, and R Cruz. 1997. Preferences and behavior of cattle grazing 8 varieties of grasses. Journal of Range Management 50:578-588.
Holechek, JL. 1981. Crested wheatgrass. Rangelands 3:151-153.
Jones, TA, MH Ralphs and DC Nielson. 1994. Cattle preference for 4 wheatgrass taxa. Journal of Range Management 47:119-122.
Shewmaker, GE, HF Mayland, RC Rosenau, and KH Asay. 1989. Silicon in C-3 grasses: effects on forage quality and sheep preference. Journal of Range Management 42: 122-127.
Smoliak, S. 1968. Grazing studies on native range, crested wheatgrass, and Russian wildrye pastures. Journal of Range Management 21: 47-50.


