Cows and Other Ruminants Actually Prefer Crested Wheatgrass

I have many problems with the article by Ken Cole that’s cited below, but the statement I found most ridiculous is highlighted in red. In paragraph three of the article he wrote: “For years the BLM in Idaho has intentionally destroyed intact sagebrush and planted the non-native crested wheatgrass in its place. BLM also seeded crested wheatgrass as a very large part of its post-fire “rehabilitation”. This was done in an attempt to increase livestock forage but it merely shifted use to native grasses such as the native poa and others because the cattle don’t like crested wheatgrass, which is coarse and high in silica.”

Reference: The Cowboy Plan to Save Sage Grouse….. Making Things Worse by Ken Cole on December 14, 2011 in Wildlife News

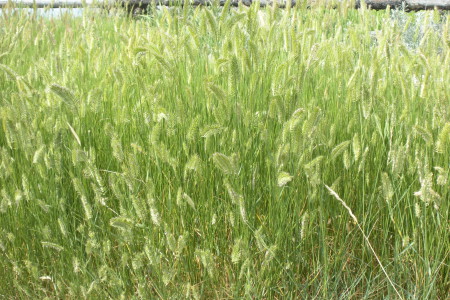
Crested wheatgrass (CWG) was planted throughout the West on both private and public land beginning in the early 1900s. It was and still is valued a forage because it is drought, heat, cold and grazing tolerant. CWG provides nutritious forage very early in the spring and is palatable to sheep, cattle, deer and elk. Livestock daily gains on CWG are often twice that of native range and gain per acre on CWG can be 10 times that of native range. CWG stands are resistant to invasion by weedy species (Holechek 1981, Dwyer and Owens 1984). However, many believe CWG should not be planted on public lands because it is not native to the U.S. I think (my opinion) it is absurd to believe rangeland managers have seeded over 12 million acres of rangeland in the U.S. to a forage livestock “don’t like.”

Cattle often prefer CWG over native grasses. During the vegetative stage and after seed head emergence, cattle strongly preferred CWG to seven native grass species (bluebunch wheatgrasses Idaho fescue, bottlebrush squirreltail, needle-and-thread, Sandberg’s bluegrass, Thurber’s needlegrass, and giant wildrye). For example in the vegetative stage, cattle spent 80 percent of their time grazing CWG and took 81 percent of their bites from CWG even though it made up only 6 percent of pasture biomass. After seed head emergence, cattle spent 92 percent of their time grazing CWG and took 90 percent of their bites from CWG. However, CWG was the least preferred grass species when grasses were dormant (Cruz and Granskopp 1998). Cattle preferred CWG to four native grasses (basin wildrye, bluebunch wheatgrass, thickspike wheatgrass, and Snake River wheatgrass) (Ganskopp et al. 1997; Jones et al. 1994). Lastly ewes allowed to freely graze different pastures, preferred to graze crested wheatgrass before grazing native range (Smoliak 1968).

As far as silica content, Shewmaker et al. (1994) determined the silica content of bluebunch wheatgrass, crested wheatgrass, squirreltail, tall wheatgrass, wild barley, Russian wildrye, bulbous barley, and great basin wildrye. Silica content of CWG leaves and stems was similar to the silica content of leaves and stems of the other grass species in the study. Bluebunch wheatgrass stems contained more silica than any of the other grasses including CWG. Furthermore, these grasses contained such low levels of silica that it was not considered a deterrent to grazing.

References:

Cruz, R and D Ganskopp 1998. Seasonal preferences of steers for prominent northern Great Basin grasses. Journal of Range Management 51:557-565.

Dwyer, DD and ME Owens. 1984. Grazing crested wheatgrass range in the Intermountain West. Rangelands 6: 29-31.

Ganskopp, D, B Myers, S Lambert, and R Cruz. 1997. Preferences and behavior of cattle grazing 8 varieties of grasses. Journal of Range Management 50:578-588.

Holechek, JL. 1981. Crested wheatgrass. Rangelands 3:151-153.

Jones, TA, MH Ralphs and DC Nielson. 1994. Cattle preference for 4 wheatgrass taxa. Journal of Range Management 47:119-122.

Shewmaker, GE, HF Mayland, RC Rosenau, and KH Asay. 1989. Silicon in C-3 grasses: effects on forage quality and sheep preference. Journal of Range Management 42: 122-127.

Smoliak, S. 1968. Grazing studies on native range, crested wheatgrass, and Russian wildrye pastures. Journal of Range Management 21: 47-50.
The First of Many Exclosure Studies

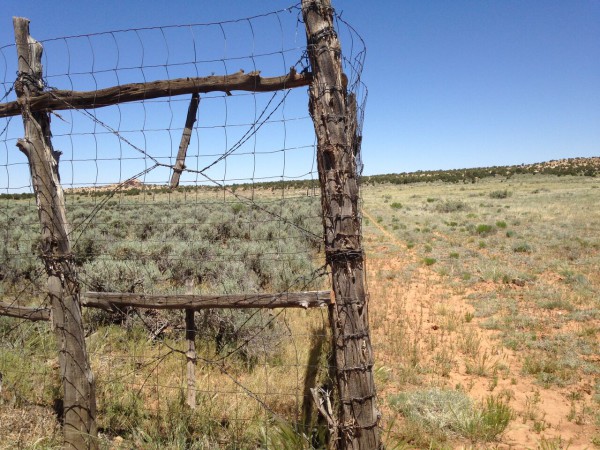
Anderson and Inouye (2001) is commonly used to show it takes a very long time for arid range sites to recover from grazing, which it can. However, in my experience, I have observed that when a paper is cited often—important information from the paper is missing. Decide for yourselves. The text in blue is taken from the public comments from the Grand Staircase Escalante National Monument Livestock Grazing Plan Amendment Environmental Impact Statement (EIS) published by the BLM in May 2014.

“In studies of long-term rest at Idaho National Engineering Laboratory, the recovery rate of native perennial grasses in sagebrush communities was slow, but real, progressing from 0.28% to 5.8% over 25 years (Anderson and Holte, 1981),” This statement is true. However, the commenters failed to mention that over the next twenty years of rest, perennial grass cover declined from 5.8% to 4.0% (Anderson and Inouye 2001). So rest beyond 25 years, at least in this study area, did not result in a further increase of perennial grasses but a decline.

They go on to say, “While non-natives such as cheatgrass had an inverse relationship to native perennial grasses (Anderson and Inouye 2001).” This statement is also true, but they failed to mention that cheatgrass was first observed in the area in 1950 on nine grazed plots but not inside the exclosure. By 1975, 25 years after livestock removal, cheatgrass had invaded 17 plots inside the exclosure. By the end of the study, cheatgrass was found on 26 of 47 core plots and was 6% of relative plant cover.

“It should be noted that in many of these plant communities, much of the seed pool has been lost due to nearly continuous removal by livestock over the past century, so recovery in arid areas such as this will be slow as Anderson and Inouye (2001) have so well documented.” This statement may be true, but it leads me to believe that Anderson and Inouye (2001) studied a reduction in the seed pool of native species. I found nothing in this paper that even mentions the seed pool.

A bit more about Anderson and Inouye (2001), they observed vegetation changes over 45 years (1950 to 1995) on 44 plots with a history of prolonged drought. Livestock were removed in 1950, so grazing and precipitation were confounded.

Average yearly precipitation from 1900 until 2000 was about 9 inches. From 1933 through 1956, yearly precipitation only exceeded the long-term average four times. The years with below average precipitation were 1949–1956, late 1970s, late 1980s, and the early 1990s. Years of precipitation above the long-term average were 1944-45, 1956 until the mid-1970s, and the early 1980s. 1993 and 1995 were exceptionally wet years. In fact, 1995 was the highest water year in 90 years.

After livestock grazing was removed, grazing by native herbivores continued in the study area. A large number of pronghorns grazed each winter. A few pronghorn and mule deer were yearlong residents. By the mid-1980s, elk moved in and numbers varied from 53 in summer to more than 350 during the winter months. Black-tailed jackrabbit numbers cycled every ten years. In 1981, densities reached nearly one jackrabbit/acre, but remained low after 1983. Cottontail rabbits and pygmy rabbits were also present. Small mammals were locally abundant. Based on the number of herbivores that continued to graze the plots, was the area really rested from grazing?

References

Anderson, Jay E. and Karl L. Holte. 1981. Vegetation development over 25 years without grazing on sagebrush dominated rangelands in southeastern Idaho. Journal of Range Management 34:25-29.

Anderson, Jay E. and Richard S. Inouye. 2001. Landscape-scale changes in plant species abundance and biodiversity of a sagebrush steppe over 45 years. Ecological Monographs 71:531-556.

Is Livestock Grazing Detrimental to Sage-grouse?

Beck and Mitchell (2000) is a review paper used to describe the negative effects of livestock grazing on sage-grouse. It is a peer-reviewed article, and the authors conclude livestock grazing is more negative than positive for sage-grouse. I had issues (my opinion) with the way Beck and Mitchell portrayed the negative aspects of grazing on sage-grouse. I’m not taking a stand on the effects of grazing on sage-grouse, I just want to point out that when Beck and Mitchell (2000) wrote the article there wasn’t much research on the topic and I think their conclusion was premature. Text in blue is taken directly from Beck and Mitchell (2000), and my comments are in black.

Direct Negatives

  1. Sheep bed grounds on ridges destroyed sagebrush used by sage grouse in heavy snows1
  2. Sheep and cattle trampling destroyed eggs1
  3. Sheep and cattle caused nest desertions1
  4. Overgrazing leads to deteriorated wet meadow hydrology; reduces grouse habitat2
  5. Heavily grazed meadows in poor condition avoided by sage-grouse2
  6. Densities of nest-depredating ground squirrels likely increased following heavy grazing3

1To stop overgrazing in the West, the Taylor Grazing Act was enacted in 1934. Grazing management has changed dramatically since the mid-1930s. Nonetheless, Beck and Mitchell (2000) used Rasmussen and Griner (1938) in their review. While their research findings were likely accurate in the mid-1930s, I think citing a 62 year-old paper based on past range conditions and stocking rates is misleading to the reader. Furthermore, Beck and Mitchell used this 1938 paper for three of the six direct negatives in their review.

2Negatives were due to overgrazing or heavy grazing—not properly managed grazing.

3This is an expert opinion, but Coates (2007) using a motion camera found that: “Wyoming ground squirrels and Piute ground squirrels encountered intact sage-grouse eggs in active nests during female incubation recesses and sometimes attempted to open eggs but were always unsuccessful as were all rodent encounters with intact eggs.”

Indirect Negatives

  1. Reduction in habitat through conversion of sagebrush to grass for livestock4
  2. Livestock grazing can promote introductions of alien weeds
  3. Winter sagebrush cover lost through sagebrush conversion to grassland4
  4. Sprayed sagebrush strips contained lower amounts of forbs for sage-grouse4
  5. Sage grouse quit nesting in areas treated with herbicides to increase grass forage4

4 I know these are indirect negatives and they were likely done in the name of cattle grazing and productivity. However, they are man-caused negatives and can be, or already have been, discontinued to protect sage-grouse. For example, state of Utah money can no longer be used to remove sagebrush from private or public land.

Beck, J.L. and D.L. Mitchell. 2000. Influence of livestock grazing on sage grouse habitat. Wildlife Society Bulletin 28:993-1002.

Rasmussen, D.I. and I.A. Griner. 1938. Life histories and management studies of the sage grouse in Utah, with special reference to nesting and feeding habits. Transactions of the North American Wildlife Conference 3:852-864.

Should a Handful of Peer-Reviewed Articles Dictate Land Management Policy?

When I think about rangeland science, I think of it as a big puzzle. Each scientific study related to rangelands is a piece of the puzzle. A single study doesn’t prove anything. With regards to public land management, it should take many, many scientific and/or case studies (including good demonstrations) before an agency adopts something as policy. This is easy for me to say since I work at a university. Often scientists create the puzzle pieces and put them in context under the implications section of their paper—then leaving the federal land management agencies to put them together and create a policy.

How do scientists and advocates use scientific literature?

I believe (my opinion) scientists and advocates use scientific studies very differently. When I write a scientific article for a peer-reviewed journal, it’s nearly always with one or more co-authors. We cite other articles from primarily peer-reviewed journals. These articles: 1) further describe the methods we used in our methods section and 2) puts our research into a context that either supports or refutes my research findings. The second type of articles usually appear in our introduction or discussion sections of the paper. Our discussion section describes how our research fits into the bigger picture. It tells the reader why we think our findings are important and why they should care.

On the other hand, groups that advocate removing all livestock grazing from public lands cite scientific literature to change public policy or sway the general public’s view of grazing. They usually cite a handful of carefully selected studies to build their case. In some instances, the portrayal of these articles is misleading or inaccurate. While several studies are enough to support a scientist’s research findings, I believe it should take a variety of peer-reviewed studies or literature reviews to create and/or change federal land management policies.

The paragraph above is definitely opinion, not just my opinion, but opinion nonetheless.

Can Public Lands Continue to be Grazed and Still Recover?

I recently found an article by Yorks et al. (1989). In my opinion, I thought it told a positive story about public land management. Yorks et al. objective was to measure vegetation in three different vegetation types in Pine Valley, Utah and to compare their results to a 1933 study published by Stewart and others in 1940. I begin this post with the history of the study site.

History of the study site: Cattle began grazing Pine Valley, Utah in 1890. About 10 years later, high-intensity and yearlong sheep grazing began in the area. Desertification was reported to be in process in the area. Erosion was moderate to severe, and in some places, exceeded 6 inches along with some dune development. In the 1930s, stocking rates were reduced and grazing at lower elevations was only allowed in the winter. A herd of feral horses was removed from the general area in the 1940’s. In 1956, stocking rate was reduced another 33%. Yearly grazing permit records showed the sagebrush-dominated areas of the study were rested from sheep grazing from 1967 to 1977, but the records may not be complete and should be accepted with caution. In 1983, stocking rate was reduced again by 25% in areas that were converted from winter sheep to winter cattle grazing. Current management is described as “rest-rotation”.

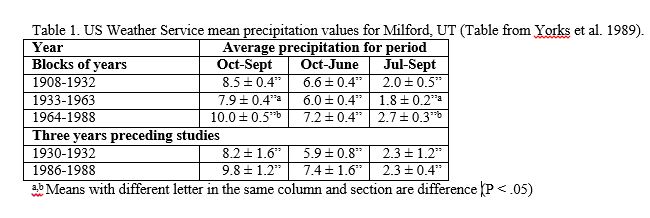
Differences between studies: According to Yorks et al., the differences and similarities between the 1989 and 1933 studies were: 1) the 19933 study used five times more labor than the 1989 study, 2) 250 plots were selected from the plots originally surveyed in 1933, 3) plots in the 1989 study were resurveyed at the same time of year and in essentially the same way, as in the original study, 4) a three-year drought period that preceded the 1989 study was similar to the drought that occurred before the 1933 study, 5) precipitation amounts and patterns from 1908 to 1932 and from 1933 to 1988 were similar. (Note: # 4 above was reported in Yorks et al. (1989), but based on Table 1 (below) I don’t see it.)

Yorks

Results:

1) Perennial grasses increased in all three vegetation types.

2) Canopy cover was greater in 1989 than 1933, more than tenfold for several perennial grasses, and less for shrubs. 3) Greater understory cover, as a proportion of total plant cover, occurred in 1989 in all three vegetation types.

4) The dominant shrubs in the study site did not reduce the growth of other plant species, nor did the shrubs maintain the same proportions as in 1933.

5) The vegetation changes were paired with time, reduced livestock numbers and length of grazing season.

Paraphrased from Yorks et al. (1989): Changes in climate may shift the relative percent of cool-to-warm-season grasses. Grass cover was higher in 1989 than in 1933, but there was no consistent shift from cool-to-warm-season grasses. This provides additional evidence that the differences observed are not a result of trends in precipitation and/or temperature. Moreover, the warm-season grasses in their study are some of the same species that have been shown to increase under heavy domestic grazing pressure in the shortgrass prairie.

Conclusions by Yorks et al. (1989): The changes observed between 1933 and 1989 is strong evidence that in at least one publicly owned area the vegetation improved. This change is concurrent with changes in livestock management due to the Taylor Grazing Act. These changes are especially notable because they occurred on public land that received no special management except reduction, not elimination, of livestock grazing. Their observations reflected a positive vegetation trend due to federal land management when no one was even thought to be watching. However, a cause-effect relationship cannot be drawn from this study.

Not all grazed lands in the United States will have the same trends observed in this study. Our results should not be extrapolated without extreme caution. Especially to areas with shorter times of recovery, after wildfire or less conservative use.

Yorks, TP, NE West, and KM Capels. 1992. Vegetation differences in desert shrublands of western Utah’s Pine Valley between 1933 and 1989. J. Range Manage. 45: 569-576.

Rest-Rotation Grazing: Information is Accurate, But So Much is Missing

Below is part of a public comment from the Grand Staircase Escalante National Monument Livestock Grazing Plan Amendment Environmental Impact Statement (EIS). It was published by the BLM in May 2014, Livestock Grazing Plan Amendment EIS: Scoping Report.

The points made in the comment, in my opinion, are accurate for the most part. But many main parts made by the authors are missing from the comment. Does the comment give the reader a good understanding of the paper? The original comment was one paragraph. I broke it in to sections and numbered each section to make it easier for the reader to follow. The comment is in blue and my comments are in black. Rest-Rotation Grazing: A New Management System for Perennial Bunchgrass Ranges by A. L. Hormay and M. W. Talbot will also be referenced.

(1) Hormay and Talbot (1961) originally developed guidance for rest-rotation grazing based on intensive field studies. I’m not certain what they mean by intensive. Hormay and Talbot (1961) did measure lots of variables and the study was very descriptive. However, they studied just three units in NE California; one was a cutover pine type, and two were grassland types. Also, no statistics were presented in the study.

(2) They stated, “While the idea of incorporating rest in grazing management is not new, the concept of longer rest periods than have heretofore been recommended, at least for mountain bunchgrass ranges, and of closer correlation of resting and grazing with plant growth requirements, is new.”  True, but the next sentence is: “Even though the rest periods under this system are longer than heretofore recommended, they are flexible.”

(3) They found that even with the rest-rotation system, some areas were more heavily used than others, re-growth was minimal on clipped plants after the seed-in-milk phase and clipping during active growth reduced total herbage yield during that year. A single season of clipping reduced basal area of forbs and grasses the next year. Four consecutive seasons of clipping at the seed-in-milk phase reduced basal area of Idaho fescue 80%, bottlebrush squirreltail 62%, longspur lupine 91% and wooly wyethia 16%. Four years’ rest after four years’ clipping resulted in little or no recovery of Idaho fescue, wooly wyethia and longspur lupine. True, but the commenters went from grazing straight to clipping (Clipping Does Not Simulate Grazing). Also, plants were clipped to 1.5” at different stages of plant growth. They were clipped once during the season except where regrowth was produced. Regrowth was clipped when full grown.

(4) They also found that cool-season grasses such as Idaho fescue varied in production by a factor of three, due to changes in annual precipitation, while the beginning of growth varied by up to a month with similar variations on time to flowering and seed ripening. I agree.

(5) Based on this research, the basic principle was to require adequate years of rest to allow the native plants to recover their vigor before again being grazed. They also recommended that it is important to include adequate monitoring of each grazed unit or pasture to determine if these rest periods are sufficient to maintain or restore production. Close enough.

I agree most of the statements above are correct, but as I stated, much information is left out of the comment that I’m not certain the reader gets a clear picture of the publication or their most important points. Below is more information from Hormay and Talbot (1961).

Hormay and Talbot’s conclusions were:

  1. Under continuous seasonal grazing some plants are repeatedly cropped closely and may die, and the production is lowered.
  2. Selective grazing is one of the main causes of range deterioration.
  3. Selective grazing cannot be prevented by adjusting stocking rate.
  4. The rest-rotation grazing system was designed to make proper rest possible and thereby increase forage and livestock production.

Steps recommended from Hormay and Talbot for a rest-rotation grazing system:

Step 1 – Graze for maximum livestock production

Step 2 – Recovery of key species. Rest may take one or more seasons, or less than a full season.

Step 3 – Rest until viable seed is produced followed by grazing (for maximum livestock production). This step is exceedingly important. It insures new seed and trampling due to grazing will work seed into the soil. Deteriorated sites are often unfavorable for seedling establishment, because the soil surface is hard and bare of litter and organic matter. Covering the seed by trampling is most important.

Step 4 – Rest to establish new plants.

Step 5 – If needed, continue rest to establish new plants.

The four basic steps may take 4, 5, 6, or more years to apply. To apply the yearly treatments, the range has to be divided into the same number of units as the number of treatments. A five-year treatment plan will probably satisfy the requirements of most bunchgrass ranges in the West. Introduced forage species can be seeded on deteriorated sites and managed with native species.

Stocking Under Rest-Rotation Grazing

  1. Stocking is based on the production and use of plants from all available forage, not just the key species.
  2. Plant species are classified as forage or non-forage; palatability is not considered.
  3. Stocking rate is calculated on the basis of production from all forage species.
  4. Stocking resulting in satisfactory range condition and livestock production cannot be determined prior to actual experience on the range. It can be estimated from forage production.
  5. Fairly heavy stocking (66% utilization) is desirable in rest-rotation grazing.
  6. A high stocking rate forces greater use of less palatable forage and less accessible grazing areas, resulting in intensive trampling where reproduction is most needed.
  7. Close cropping and trampling can be tolerated because the range is rested at critical times.
  8. Were it not for soil erosion, practically all of the vegetation in grazed units could be utilized.

Season of Grazing

  1. Hormay and Talbot provide a general guide for selecting a suitable grazing season, assuming the vegetation behaves like Idaho fescue.
  2. Since rest-rotation grazing maintains rangeland regardless of the time of beginning and ending of the growing season, the choice of seasons is up to the livestock operator.

Livestock Distribution

  1. Rest-rotation grazing generally results in better livestock distribution and more complete use of the available forage.
  2. To improve control of distribution within pastures use water developments, salt, riding or herding.
  3. When cost of fencing is prohibitive, consider: 1) closing water on rested areas, 2) leaving water open on grazed areas, and 3) placing salt in strategic locations to get desired distribution.

“In effect, grazing is eliminated as an environmental factor under rest-rotation grazing.”

When Does Science Become Advocacy?

Advoacy and Policy
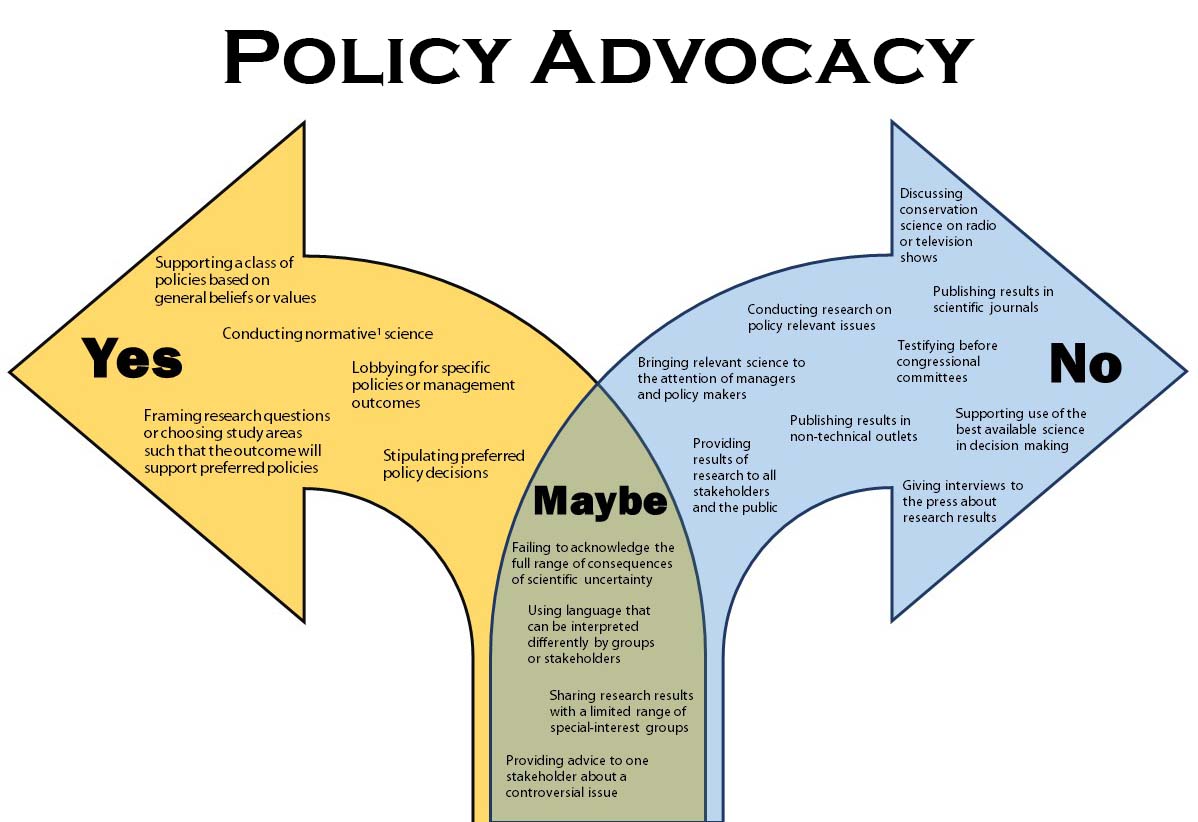
The graphic presents examples of actions that scientists take in conducting and reporting research. Listed actions on the left represent actions of policy advocacy, those on the right do not, and the center is a gray area. This is an adaptation of policy advocacy graphic and article by Scott et. al (2007). Click on the photo to make it larger.


1
In the applied sciences, normative science is a type of information that is developed, presented, or interpreted based on an assumed, usually unstated, preference for a particular policy.

Scott, J. M., Rachlow, J. L., Lackey, R. T., Pidgorna, A. B., Aycrigg, J. L., Feldman, G. R., … & Steinhorst, R. (2007). Policy advocacy in science: prevalence, perspectives, and implications for conservation biologists.Conservation Biology, 21(1), 29-35.

Clipping Does Not Simulate Grazing

Clipping studies are used by some groups to point out the potential ill effects of grazing on plant health. According to Trlica and Rittenhouse (1993), plant ecologists often focus on the defoliation aspect (removal of plant material) of grazing and how individual plants respond to defoliation. A large number of studies have used clipping treatments, rather than grazing animals, to defoliate plants. Ecologists often assume clipped plants and grazed plants responded equally, but many studies have shown clipping cannot be used to simulate grazing.

Finding an article that compared clipping to grazing meant going back to the 1960s. Compared to clipping, livestock 1) tend to graze plants to different heights, not to a single uniform height; 2) remove less plant material; 3) eat specific plant parts rather than the whole plant; 4) may change plant size and form by selecting certain individual plants within a species; 5) affect the build-up of plant litter differently; 6) add nutrients to the soil through urine and feces; 7) trample the area they graze; 8) change forage preferences during the grazing season; 9) affect the competition from neighboring plants through grazing; 10) do not graze all plants continuously throughout the grazing season (Jameson 1963).

In 1975, Rickard et al. reported that clipping studies do not simulate how cattle graze plants. Especially if animals are able to select among multiple plant species and plant parts over a large area. Working in south-central Washington, a 9” precipitation zone, they concluded that it would take many years of moderate grazing before shifts in plant species composition and abundance would be noticed.

Some researchers have tried to mimic grazing through clipping. They found that these clipping treatments were not as severe as the treatments where plants were clipped to a uniform height. For example, when half of a bluebunch wheatgrass plant was clipped the basal area increased by 18.6%. However, if the entire plant was clipped the basal area decreased by 7.8%. The basal area of unclipped plants increased by 5.2%. In this study, plants were clipped to a 3” stubble height just before seedheads emerged (Clark et al. 1998). When compared to unclipped plants, Stroud et al. (1985) reported that simulated grazing of western wheatgrass did not decrease above or below ground production (roots and rhizomes) provided season-long utilization (clipping) was below 80%. Tiller numbers, however, increased 28% on unclipped plants compared to plants under simulated grazing. Simulated grazing involved clipping individual plant tillers one to four times during the growing season. Clipping intensity on tillers was 33%, 67%, or 100%. For most simulated grazing treatments, season-long utilization ranged between 64 and 79%.

After an extensive review of the literature on herbivory, Maschinski and Whitham (1989) came to the following conclusions: A plant’s response to herbivory is flexible. Herbivory can be detrimental, neutral, or even beneficial for a plant depending on conditions and its ability to replace tissue eaten by herbivores. The effect of grazing on plants depends on the frequency, intensity, competition, nutrient availability, timing of grazing, and the weather.

References

Clark, PE, WC Krueger, LD Bryant, and DR Thomas. 1998. Spring defoliation effects on bluebunch wheatgrass: II. Basal area. Journal of Range Management 51:526-530.

Jameson, DA 1963. Responses of individual plants to harvesting. Botanical Review 29(4): 532-594

Maschinski, J and TG Whitham. 1989. The continuum of plant responses to herbivory: the influence of plant association, nutrient availability, and timing. American Naturalist 134:1-19.

Rickard, W.H., D.W. Uresk, and J.F. Cline. 1975. Impact of cattle grazing on three perennial grasses in south-central Washington. Journal of Range Management 28:108-112.

Stroud, DO, RH Hart, MJ Samuel, and JD Rodgers. 1985. Western wheatgrass responses to simulated grazing. Journal of Range Management 38:103-108.

Trlica, MJ and LR Rittenhouse. 1993. Grazing and plant performance. Ecological Applications 3:21-23.

Sauer (1978) More Than Just Dead Leaves

Currently, I’m selecting material for my blog posts from a recently published article, Carter et al. (2014). Authors of the paper represent Grand Canyon Trust, Western Watersheds, Foundation for Deep Ecology, Kiesha’s Preserve and Wild Utah Project. Carter et al. (2014) is a peer-reviewed paper published in a new, rather obscure (in my opinion) journal, International Journal of Biodiversity. After reading the paper, I questioned and researched some of the authors’ statements and the articles they used to support those statements. I begin with Sauer (1978). (Note: Words in bold are the points I address in my post.)

According to Carter et al. (2014): “Grasses with attached dead leaves are more productive than grasses from which the dead leaves have been removed. Loss of these dead tissues to grazers increases thermal damage to the growing shoots and reduces the vigor of the entire plant [28].” According to the reference section in Carter et al. (2014) reference 28 is Sauer (1978).

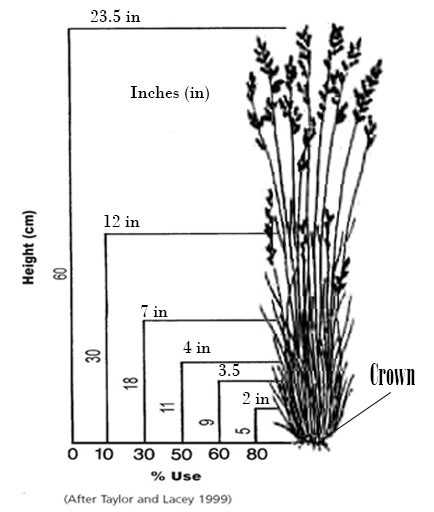
Sauer graphic

Clipping to the crown is much shorter than 80 percent utilization. Normally, the recommended utilization level for livestock grazing is 50 percent.

Dead Leaves: Sauer (1978) didn’t just remove dead leaves from dormant bluebunch wheatgrass (BBWG), he removed all dead plant material: leaves, stems, nodes, sheaths and inflorescences.

Grazers: Carter et al. (2014) doesn’t define grazers. In Sauer (1978), BBWG plants were not grazed they were clipped with scissors to the crown leaving no stubble. Clipping was much more severe than almost any livestock grazing.

Thermal damage: Sauer (1978) doesn’t mention thermal damage or plant vigor in his paper.

Vigor: Sauer (1978) reported that clipping all standing dead from BBWG did not change the number of flower stalks or the height of the flower culms plants produced than when compared to unclipped plants. BBWG vigor can be determined by combining the number of flower stalks with the maximum length of flower culms (Mueggler 1975). Basal area has also been used to measure vigor (Clark et al. 1998). Sauer (1978) reported the basal areas of clipped plants were not different from unclipped plants. Thus, BBWG vigor was probably not affected by removing dead material from BBWG plants.

So what did Sauer (1978) find? He found that removing all standing dead material decreased the weight of new leaves and stems by 28%, decreased the loss of standing dead by 21% and decreased leaf length by 25%. Sauer concluded that standing dead is not a deterrent to growth and beneficial to bluebunch wheatgrass.

References:

Carter, J., A. Jones, M. O’Brien, J. Ratner, and G. Wuerthner. 2014. Holistic Management: Misinformation on the Science of Grazed Ecosystems. International Journal of Biodiversity. http://dx.doi.org/10.1155/2014/163431

Clark, PE, WC Krueger, LD Bryant, And DR Thomas. 1998. Spring defoliation effects on bluebunch wheatgrass: II. Basal area. J. Range Manage. 51:526-530.

Mueggler, W. F. 1975. Rate and pattern of vigor recovery in Idaho fescue and Bluebunch wheatgrass. J. Range Manage. 28(3): 198-204.

Sauer, R.H. 1978. Effect of removal of standing dead material on growth of Agropyron spicatum. Journal of Range Management 31:121–122.

Most Range Research Cannot Be Applied World-Wide

The arid desert of the western United States is largely composed of public lands and seas of sagebrush. On these rangelands, cattle and feral horses have grazed alongside each other for centuries. But in recent years, the feral horse population has increased. According to data from the Bureau of Land Management (BLM), Wild Horse and Burro Program, there are 58,150 feral horses grazing the Western U.S. and another 46,492 are in BLM holding facilities.

A recent article written in the Washington Post addresses the western issue, “U.S. looks for ideas to help manage wild-horse overpopulation,” written by Lenny Bernstein and Brady Dennis. In the article, Executive Director of Protect Mustangs Anne Novak was quoted stating when equines graze along cattle, it leads to a healthier cow. Novak cites a livestock grazing research experiment conducted in Kenya, Africa to corroborate her view.

Novak, of Protect Mustangs, dismissed the notion that wild horses have destroyed grazing lands that ranchers need to feed their cattle. She cited work by Princeton University researchers that shows that allowing wild animals to graze alongside cattle can actually result in healthier cows. Their conclusions were based on studies conducted in Kenya, where cattle paired with donkeys gained 60 percent more weight than those left to graze only with other cows. The researchers said that the donkeys ate the upper portion of grass that cows have difficulty digesting, leaving behind lush lower vegetation on which cattle thrive.”

Novak failed to mention important facts surrounding the study. The research was conducted in Kenya where environments receive 15 to 30 inches of precipitation a year, in a tri-modal pattern. It is located near the equator and have a year-round growing season—provided there is adequate moisture for plant growth. The research, however, cannot be applied to the arid West because in general it has cold winters and much of its precipitation comes as snow. The growing season occurs primarily in the spring, summer and early fall depending on precipitation—which is always a gamble in the west.

The Princeton University research (cited in the article) recorded the Kenya vegetation cover averaged around 77.8 percent. In comparison, the vegetation cover in central Nevada ranges from 10 to 15 percent, according to the Online Nevada Encyclopedia. The levels of available forage and forage growth in Kenya is considerably different than central Nevada. Note: We used Nevada as an example because it is the state with the most acres of public rangeland allotted to feral horses.

Even though donkeys benefited cows during the wet season in Kenya, things changed during the dry season. The research showed that during the dry season, cattle and wild herbivores competed for forage (Odadi et al. 2007). This research study was not only beneficial for cows, but for equines as well. The research found when herded together during the wet season both cattle and donkeys gained more weight, had higher bite rates, and selected more balanced diets—than when foraging separately. In addition, parasite egg output in feces of donkeys was reduced by 14–35 percent after foraging with cattle (Odadi et al. 2011).

The research conducted in Kenya does not adequately represent the Western feral horse environments, so why compare them? It may be useful research for livestock producers in Kenya, but not for the average western U.S. rancher.

References

Odadi, W. O., T. P. Young, and J. B. Okeyo-Owuor. 2007. Effects of wildlife on cattle diets in Laikipia rangeland, Kenya. Rangeland Ecology and Management 60:179–185.

Odadi, W. O., M. Jain, S. E. Van Wieren, H. H. T. Prins, and D. I. Rubenstein. 2011. Facilitation between bovids and equids on an African savanna. Evolutionary Ecology Research 13:237–252.