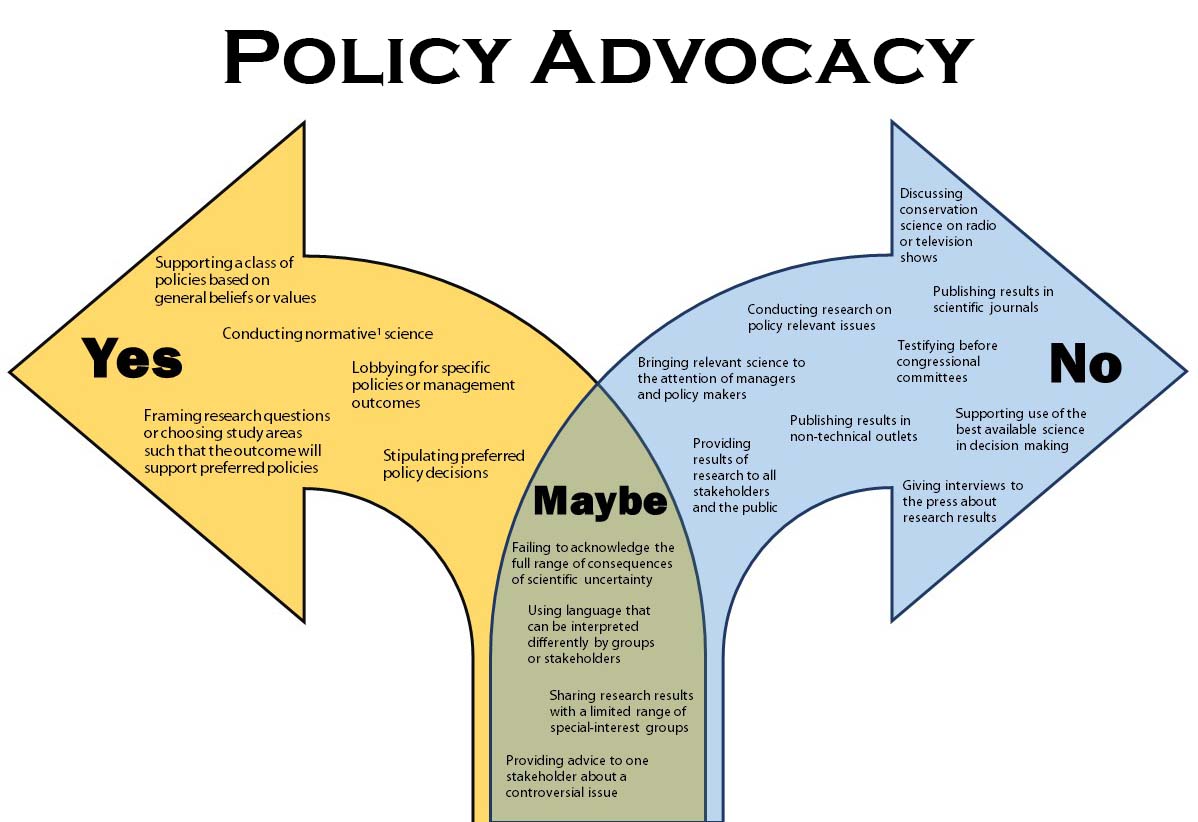
This is how I analyze a news article, at least in my head. I ask questions. I want to know where the information in the article originates. It’s easier to read the original article without my comments. You can connect to it by clicking on its title below. My comments about the article are in bold and italics, and text that I consider opinion is in green.
The article below was written for Wildlife News, and it’s easy to assume that Wildlife News is pro-wildlife. I like wildlife, however, I don’t know their stand on grazing livestock on public lands. I think I can guess, but I’m not sure. I look at the keywords for the article; they are: BLM, Department Of Interior, Economy, Grazing and Livestock, Public Lands. It doesn’t say opinion or commentary so I assume it is news.
Article Title: BLM Public Lands Grazing Accounts for Only 0.41% of Nation’s Livestock Receipts
By Ken Cole On August 15, 2013·In BLM, Department Of Interior, Economy Grazing And Livestock, Public Lands
The recently released Department of Interior Fiscal Year 2012 Economic Report shows that Grazing on BLM Public Lands Accounts for only 0.41% of the nation’s livestock receipts and only 17,000 jobs. In contrast, recreation accounts for 372,000 jobs and contributes $45 billion to the economy.
Comment: The article begins with accurate statements from the Department of Interior (DOI) Fiscal Year 2012 Economic Report. However, I think they should have used the same measure, direct economic output. According to DOI report: “Direct economic output attributable to public land forage for FY 2012 was estimated to be approximately $808 million dollars.” Page 60. $808 millions dollars is still much, much less than $45 billion. Comparisons should be made in the same units.
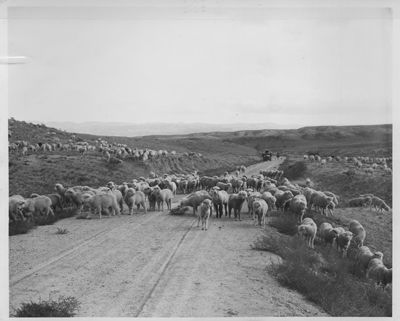
According to the report, the BLM permits 12.4 million animal unit months (AUM’s) but only about 9 million AUM’s were billed in 2012 and the average during recent years is only about 8 million AUM’s. An AUM is the unit of measure for livestock grazing and equals to forage needed to support one cow/calf pair or five ewes and their lambs for one month. The rate for an AUM in 2012 was $1.35, which in terms of inflation, is lower than it has ever been. As of 2011, the BLM has about 18,700 active permits on more than 21,000 allotments across 155 million acres.
Comment: The DOI report also stated: “The remaining AUMs were not used due to resource protection needs, forage depletion caused by drought or fire, and economic and other factors.” Page 59. This statement is important considering the statements made below about the BLM.

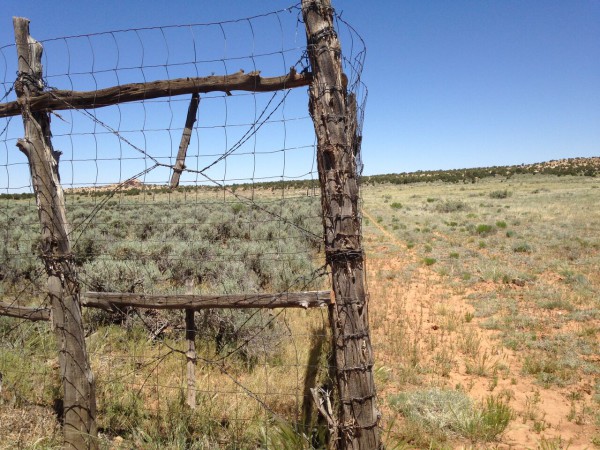
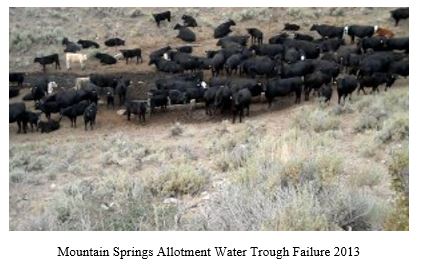
The report goes on to rationalize the reason for the low rates as compared to private grazing lands where the market price was $16.80/AUM in 2011. Public lands are not as productive as private lands and private landlords may provide and maintain other amenities such as water developments or fences for the ranchers. Unfortunately, even with the absurdly low rates, ranchers routinely ignore fence and water development maintenance. (Comment: How many ranchers don’t fix fences or maintain their water development?) On nearly every trip to the field I have made over the years, I witness cattle inside poorly maintained exclosures or sign that they have been there. (Comment: How many trips? Over what area? Which years? Who is supposed to maintain exclosures? What do you mean by sign of cattle?) I also routinely witness water troughs that completely fail or that leak onto the ground creating a stinking, muddy, manure and urine filled mire that is ideal habitat for West Nile Virus infected mosquitos and pollute other surface waters and groundwater. (Comment: Define routinely. What do you mean by completely fail? How many different troughs over what time period?) These same troughs also lack the required bird escape ladders (Comment: All of them, because more and more troughs are being fitted with bird escape ladders) and sometimes are filled with dead wildlife. (Comment: What do you mean by filled? The link goes to the following article: “More Ranching Custom and Culture. Dead Wildlife in Water Troughs. By Ken Cole On August 30, 2011 In Advocacy, Conservation, Public Lands, Western Watershed Project.” So if you follow the link above, you’re sent to an article labeled advocacy and you’re no longer reading news.)
The report does admit that the absurdly low grazing rates “creates an incentive to use federal forage before using other forage sources and perhaps to use federal grazing allotments more intensively than privately owned rangeland.” (Comment: I find this statement from the report interesting since agencies determine when and how long livestock are on an allotment.) This is clearly evident when you visit many western grazing allotments. Often, private rangelands are in considerably better condition than our public lands, especially in drought years when permittees often increase their use of public lands except for the rare case when the BLM recognizes the drought conditions. Even then, since there is a large discrepancy between the number of AUMs permitted and the actual number of AUMs used, any cuts to grazing during drought years are only imaginary and use increases over previous years anyway. (Comment: The DOI report includes a graph of AUMs used from 1970 to 2012. The figure caption states: “Figure 8-1 shows the downward trend in AUMs used, from 12.8 million in FY 1970 to less than 9 million in FY 2012.” Page 60. Based on the graph AUMs have decrease— not increased.) This phenomena is occurring this year in parts of Idaho where the BLM and the USFS have failed to make any significant cuts to grazing during a severe drought.
Comment: The text in green font I believe to be either opinion or inaccurate information. None of the information above or below in green is in the DOI Report nor is the word “absurdly”.
The public lands grazing program among all agencies, according to a General Accountability Office report, cost $144 million in 2005 and received only $21 million in grazing fee receipts.
In contrast, compare the economic benefits to recreation, an activity, generally, that is far less damaging to landscapes and habitats than livestock grazing. Recreation supports 372,000 jobs and contributes $45 billion to the economy. Arguably, livestock grazing greatly reduces the value of a landscape for recreation. With polluted water, degraded wildlife habitat, hundreds of thousands of miles of barbed wire fence that tear clothes, gates that are nearly impossible to open and close, predator killing to protect livestock, aggressive guard dogs, and many other impacts, livestock grazing eliminates or detracts from the value of the landscapes that would otherwise support much more wildlife and unhindered recreation.
When you compare the economic values of one activity over another and then compare the undue political influence that welfare livestock interests have over everything else, it is clear that livestock grazing on public lands is out of place with modern values. The federal agencies that manage livestock grazing on public lands are failing to properly manage livestock and ranchers have subdued them from doing so at the taxpayers’ expense.
The report has a curious error though. A chart contained in the appendix shows the inflation adjusted grazing fee but calculates the value in 2012 dollars incorrectly. Here is the correct data with additional years and data for the USFS, which is part of the Department of Agriculture not the Department of Interior.
Comment: I agree with the authors. The chart doesn’t seem to be correct, which doesn’t give me confidence about using government documents.
